
 BLOG
BLOG 


The Importance of Full Frame-Rate Sports Video Analysis for Sponsorship ROI Valuation
If You’re Not Analysing Every Frame Can You Really Rely On The Data?
There are many providers of sponsorship ROI valuation services in the market and they all claim to deliver highly accurate data. But there’s a dirty secret in the industry; the data is NOT truly accurate!
That’s not to say that the data is wholly unreliable, it’s simply not as accurate as it should be. In some cases this data over-values the exposure duration of a specific brand, and in other cases it under-values it.
So let’s dig into why this happens, why it’s important to have 100% reliable data, and what the solution is to this challenge.
Why Can’t Most Sponsorship ROI Analysis Companies Provide 100% Perfect Data?
To understand this, you need to first understand some key numbers. So, let’s take an average sports video that is 2.5 hours long and recorded at 30FPS.
- Length in Hours = 2.5
- Length in Minutes = 150
- Length in Seconds = 9,000
- Number of Frames = 270,000 frames
This means that, for a single average sports video, you would have to review 270,000 frames.
A team like the Milwaukee Brewers in MLB will play 278 games (between home and away fixtures) in a single season.
This means that if you wanted to deliver 100% perfect data for the Brewers games, so they could deliver that data to their sponsors, you would have to review over 75 million frames within a season, and that’s just for one team!
But it gets worse. On average every frame would contain 6 unique brand exposures. In other words 6 different brands will be shown in each frame, spread across structure assets, apparel, equipment, etc. And there could be multiples of each brand in each frame.

But if we simply take the conservative number of 6 exposures per frame, it means:
- Detections to review per game = 1.6M
- Detections to review per season = 450M
The final important point to note is that teams and rightsholders want to get the data back for each game as soon as possible. For them, the sooner the better. This is important so they can make adjustments to physical assets as well as adjusting their sponsorship pricing as needed. But it’s also important to the brand sponsors too. Longer term sponsors can use the data in conjunction with consumer survey and sales data to confirm that the sponsorship is working and short term sponsors can see that they are getting value from their spend. So in real terms the data needs to be available in days rather than weeks or months after the fixture aired.
By now, you may be starting to understand the scale of the issue. How can you review 270 thousand frames to tag 1.6 million detections in say 5 days?
It would take a single person marking an exposure every 12s (a fast and experienced annotator could achieve this) for 8 hours/day, 667 days to mark this number of detections. Almost 2 years! To do it in 5 days would require an army of 133 annotators working flawlessly and diligently for 8 hours per day.
Remember, this is for a single game, so when you scale it up by 30 or so teams playing games on roughly the same days, it becomes a challenge of scale and cost.
So, what do they do?
They simply reduce the size of the challenge by only analysing one frame per second (some may do 2 to 3). This reduces the workload from 1.6M exposures to be reviewed down to 53,300 per video.
Once they have analysed these frames, they apply simple logic that says if a brand was visible in frame 1 and also frame 31, then its duration is 1 second. Similarly if it was visible in frame 1, 31 and 61, then its duration was 2 seconds.
In some cases, they may increase the number of frames and use AI to take some of the extra workload of auto detecting the brands and placements (the objects the brand was on when detected), but this comes with its own challenges because AI is not perfect and so can make some mistakes. This requires deep knowledge of how to train the AI to deliver the highest accuracy and you may need to introduce QA processes to check the work the AI has done.
Despite all this, checking even a reduced number of frames takes time and nobody wants to hire hundreds of humans because it would simply be cost prohibitive. So instead, they use a smaller team, which means that the results are made available often 4 weeks or more after the fixture aired.
Why Is This Approach Unreliable?
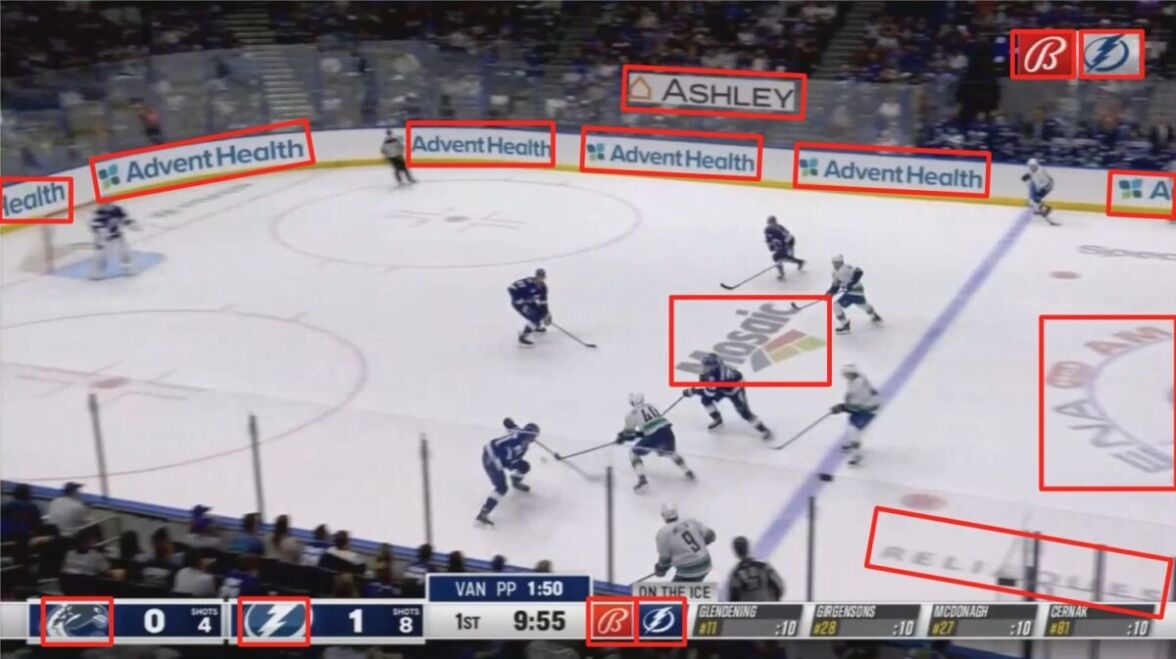
In simple terms, it relies on assumptions and inferences. Let’s take the below as an example:

Above we see the first frame from 3 seconds worth of video in NHL. Using this 1 FPS method, we only see Spectrum arrive in the second frame and it’s still present in the 3rd frame. This would mean an assumed duration for this brand of 1 second.
However, if we analyse all 30 frames from each second of video, we see that Spectrum first appears in Frame 8 of 30:34s (we haven’t shown every frame in the images below for simplicity).

This makes the true duration for the Spectrum exposure 1.73s.
Obviously this processing of only one frame per second can also over-inflate the duration, where a logo only appears in a single frame and is not present in the next frame, the assumption must be that its duration was 1 second, where in reality it may have disappeared by Frame 15, making it only 0.5s in reality.
 Be Sure To Also Read ->Sponsorship Monitoring Use Case Overview
 The Problem Of Exposure Area
The final factor is where the camera zooms in or out during the exposure…

Again, you must assume a linear average between these two sizes, but it may be that the camera was panned out for most of the duration with only a fraction of the time spent zoomed in. Therefore the exposure size would be under or over valued.
When all these moments are summed, it can amount to significant variances in exposure percentages across brands and placement combinations.
The Lack Of Transparency
The last issue with this approach of limiting the number of frames analysed, is the lack of transparency in the results. If you’re not tracking exposures across every frame, you cannot provide videos showing all the detections because it is likely that the bounding boxes will appear late or finish early. Also, the technique of analysing only one or a small number of frames per second means that you are not actually processing video, but rather converting the individual frames into static images. This means you lose the connection between frames in the video and so clips for every detection cannot be provided.
This means that in most cases, these companies simply provide a report of exposure by brand and placement combination, with no video clips per exposure provided. The teams and rights-holders therefore need to simply trust the data, with no way to confirm its accuracy.
Processing Every Frame Is Key
We have therefore established that processing every frame is critical to delivering highly accurate and transparent data, supported by clips for every exposure. But how do you overcome the issue of having to review 270 thousand frames and 1.6 million detections? It simply comes down to how well the computer vision system has been developed and trained.
You might have guessed already, but at VISUA, we deliver full framerate processing, so our clients get the most accurate exposure data down to the millisecond, backed by snapshots and short clips for every detection. Best of all, our turnaround per game is very flexible. Some clients have a need for near-realtime results, so we complete the processing within a few hours of receiving the footage. In other cases, clients are happy to wait a few days (which reduces the cost) and so turnaround is typically 3 to 4 days.
How do we achieve this? Well that’s our secret sauce and what truly differentiates us from other offerings in the market. But simply put, it’s years of knowledge in processing every major US sport and many other international sports. All that knowledge has allowed us to train a highly efficient AI system, with limited need for human input, so, not only is it fast, it’s extremely cost-effective.
Want to talk?
If you are a team, league, rights-holder or sponsorship agency, and you’re looking for the most accurate data available today, we’re here to discuss your sports sponsorship ROI tracking project. VISUA’s system is also highly flexible, so if you have specific requirements we’re up for the challenge. Please fill in the form below and we’ll be in touch soon.
RELATED
 14 Key Sports Sponsorship Metrics To Measure Posted in: Sponsorship Monitoring - Reading Time: 6 minutesTLDR: Record growth in viewing and engagement by fans is driving record investments in sponsorships. But brands also need to measure the […]
 It’s Amazing What’s Possible With Visual-AI For Sponsorship Monitoring Posted in: Sponsorship Monitoring - Reading Time: 2 minutesYour Brand Sponsorship Monitoring Platform Powered By Best-In-Class Enterprise Visual-AI Sponsorship spend has enjoyed significant growth in the last decade, with 2018 […]
 The Three Key Reasons Why Accurate Monitoring Is Crucial For Sponsors Posted in: Sponsorship Monitoring - Reading Time: 7 minutesTLDR: Accurate sponsorship monitoring is the only way to be sure that your investment is really paying off. Reliable data is crucial […]

VISUA & Vision Insights Partner To Usher In New Era In Sports Sponsorship Intelligence
Reading Time: 4 minutesIntegrated partnership sees Vision Insights integrate VISUA’s Sports Sponsorship Monitoring Computer Vision Suite into its new Decoder…
Featured Sponsorship Monitoring Technology VISUA News
VISUA Unveils Infringio: The AI-Powered Shield Against Copyright and Trademark Lawsuits
Reading Time: 4 minutesDublin and New York-based VISUA Leverages its market-leading Visual-AI technology suite within Infringio, to scan images for…
Featured Technology Trademark Protection VISUA News
Computer Vision Leader VISUA Launches Low-Code & No-Code Implementation
Reading Time: 3 minutesDublin and New York-based VISUA now allows API-less use of complete Computer Vision Technology Stack Leading Computer…
Featured Technology VISUA News